
When it comes to finding my next read, I can be quite picky about it! I’ll usually research the latest best sellers and different book-award lists (eg. the Booker Prize Shortlist/Longlist of the year), and will also look for reviews from fellow book lovers. My book choices will also depend on my current state of mind and the topics I’m currently interested in.
Shows like the BBC2’s Between The Covers are amazingly helpful help when looking for an interesting next read. The show chooses and discusses lots of great books, serving as an immense reading inspiration for its viewers.
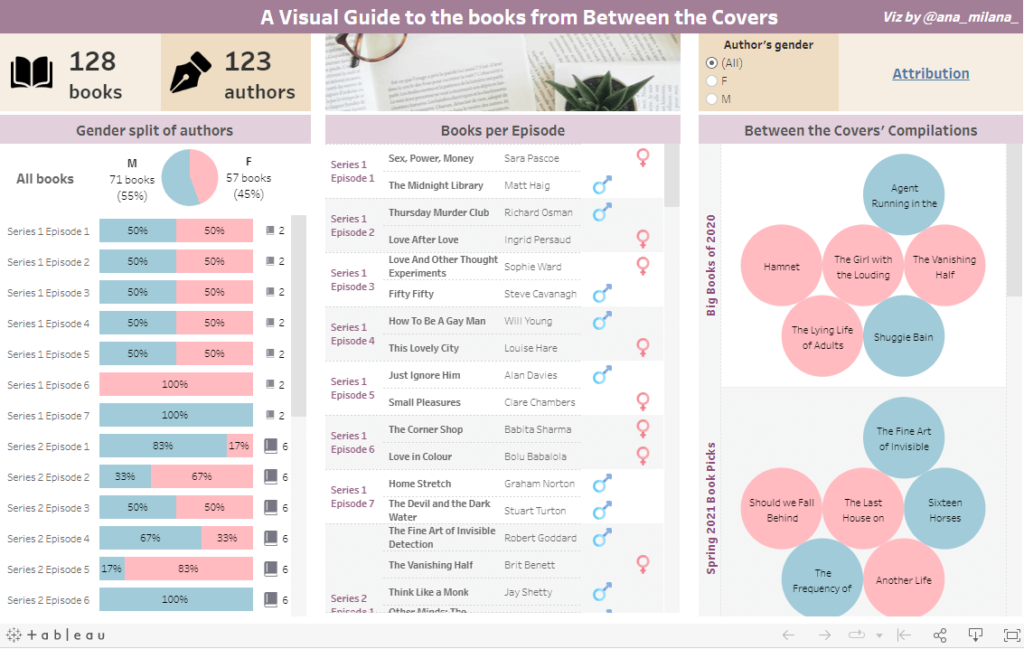
This year the feminist in me became curious about the ratio of male/female author’s within their book recommendations, so I decided to analyse their gender diversity spread.
For this, I collated a list of all the book recommendations they’ve shared along the show, and I graphed them out into the above Tableau data visualization.
While doing this, I also created an easily accessible way to see the book lists for the different episodes and seasons – hopefully this will also serve as a handy reading list for you and your fellow book readers!
Notes about this data viz
For sources and attribution, please see this link.
If you find any errors or items that need changing, please get in touch via Twitter or email me at nana7milana@gmail.com